Tec ICS — Integrated Control System
Replaced legacy hardware control panels with a web-based building temperature management system
Designed and built the front-end for Tec ICS — replacing physical building control panels with a web application. Enabled 100% remote access, eliminated on-site dependency for temperature management.
The Problem
Building temperature management relied on physical control panels mounted in mechanical rooms. Only trained technicians could operate them, they had to be physically present, and there was no visibility into what was happening across the building.
I worked with facilities teams who managed large commercial buildings. Their workflow was:
- Receive complaint about temperature
- Walk to mechanical room
- Find the right control panel (sometimes multiple floors away)
- Adjust setpoint
- Wait and hope it worked
- Walk back if it didn't
For a 40-story building, a simple temperature adjustment could take an hour.
My Role
This project was unique: I wore both designer and developer hats.
As designer, I:
- Designed the entire UI in Figma
- Created the information architecture
- Mapped physical control metaphors to digital equivalents
- Conducted usability testing with facilities teams
As React developer, I:
- Built all front-end components
- Implemented real-time data visualization
- Created the responsive framework
- Worked with backend engineers on API integration
Why both roles mattered: The typical design-to-dev handoff creates friction. As both designer and developer, decisions were immediate. When I designed something that was technically awkward, I knew instantly. When I found a better implementation approach, I could update the design immediately.
The Design Challenge
Respecting 30 Years of Mental Models
Facilities technicians had used physical control panels for decades. They had deep expertise — knowledge about which zones affected which areas, how systems interacted, what settings worked for different conditions.
The temptation: Reimagine everything for digital. Clean slate. Modern patterns.
The reality: That expertise was an asset. The best design would preserve their mental models while extending them with digital capabilities they couldn't have before.
Observation
Week 1-3I spent time in mechanical rooms, watching technicians work. I mapped how they thought about buildings — by zone, by floor, by system. Not by database tables or API endpoints.
Physical-to-Digital Translation
Week 3-6Every physical control needed a digital equivalent that felt familiar. The temperature dial became a slider with the same range. The zone map became an interactive building view. The alarm lights became notification cards.
Extending, Not Replacing
Week 6-16Digital could do things physical couldn't: historical trends, cross-zone comparison, automated scheduling, remote access. These extensions built on familiar foundations.
Don't ask users to unlearn 30 years of expertise. Build on what they know. Extend it with what digital makes possible.
Design Solutions
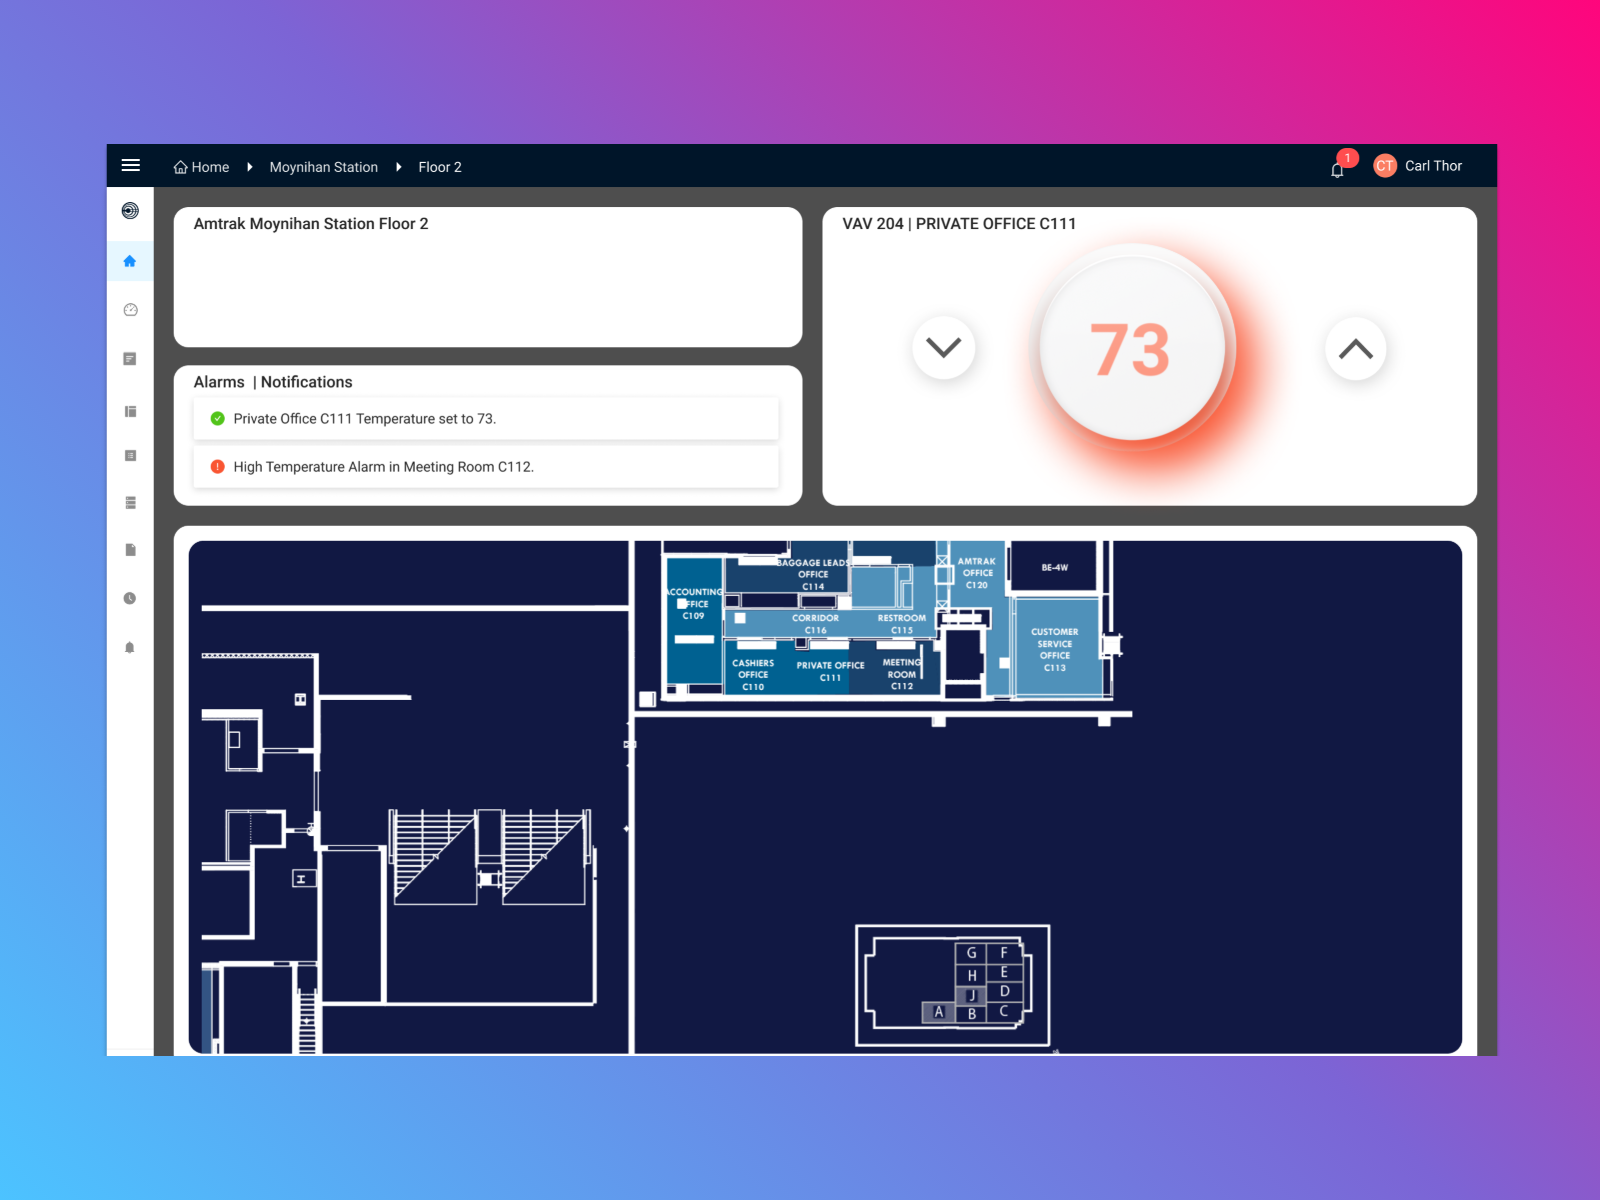
Real-Time Zone Dashboard
At-a-glance view of all building zones with live temperature data, system status, and active alerts.
Building Zones
Key design decision: I organized zones spatially, matching how the building actually looked. Technicians thought in terms of "the west wing" and "floors 10-15," not "Zone-ID-447." The interface matched their mental model.
Intuitive Setpoint Controls
Digital controls that feel familiar to technicians accustomed to physical interfaces.
Zone A - Conference Room
Temperature Control
Current Temperature
Setpoint
72°F
What made them work:
- Immediate feedback — Change a setpoint, see the target update instantly
- Undo capability — Physical panels don't have undo. Digital should.
- Scheduling — Set different temperatures for different times (impossible with hardware)
- Constraints visible — Show min/max ranges, not just current value
Alert & Notification System
Proactive alerting when temperatures deviate, equipment malfunctions, or readings fall outside range.
Active Alerts
2 ActiveTemperature rising above setpoint
Compressor malfunction detected
Priority-based design:
- Critical: Equipment failure, safety threshold breach → Immediate notification
- Warning: Approaching limits, unusual patterns → Dashboard highlight
- Info: Scheduled changes, completed actions → Log entry
The key insight: Physical panels had alarm lights, but you had to be there to see them. Digital alerts meant technicians knew about problems before tenants complained.
Historical Trends
Temperature visualization over time for each zone. Pattern identification, efficiency optimization, compliance documentation.
24-Hour Trend
Conference Room A
Use cases this enabled:
- "Why is the 12th floor always cold at 3pm?" — See the pattern, find the cause
- "Are we wasting energy overnight?" — Compare occupied vs. unoccupied hours
- "Prove we maintained compliance" — Export data for audits
Technical Implementation
The Designer-Developer Advantage
Wearing both hats let me make better decisions faster.
Example 1: Real-time updates I designed animated transitions when temperatures changed. As a developer, I realized WebSocket updates could come faster than animations completed. I redesigned to batch updates and use CSS transitions that interrupted gracefully.
Example 2: Mobile responsiveness Initial design had detailed zone cards. As a developer building the responsive version, I found the cards didn't work on mobile. I redesigned for progressive disclosure — summary on mobile, details on tap — rather than forcing a compromised desktop design.
Example 3: Data loading states Designing in Figma, loading states were an afterthought. Building in React, I realized loading was the first thing users saw. I redesigned loading to show structure immediately, with data filling in — skeleton screens instead of spinners.
Guiding Principles
- Trust through reliability — The interface must feel as dependable as physical controls. No lag, no uncertainty, no "did that work?"
- Progressive complexity — Simple monitoring on surface, detailed controls on demand. Novices and experts both succeed.
- Spatial thinking — Organize by how buildings work, not how databases work. Zones, floors, systems — not tables and IDs.
Results
Operational Impact
| Before | After |
|---|---|
| On-site required for any change | 100% remote access |
| Reactive (complaint → response) | Proactive (alert → response) |
| One technician per building | One technician, multiple buildings |
| Manual compliance documentation | Automated reporting |
Team Impact
- Eliminated on-site dependency — Technicians could manage buildings from anywhere
- Reduced response time — From hours (travel + diagnosis) to minutes (alert + remote action)
- Scalable staffing — One technician could now monitor multiple buildings remotely
"I used to drive 45 minutes to turn a dial. Now I do it from my phone while eating breakfast. My whole job changed."
What I Learned
The feedback loop between design and implementation was instant. No handoff friction, no "that's not what I designed," no waiting for implementation to validate assumptions. I'd do this again for any project where speed and iteration matter.
My first instinct was to modernize everything. The better instinct: preserve what works, extend with what's new. Users aren't blank slates. Their existing knowledge is a foundation, not an obstacle.
Some things translated perfectly (temperature dials → sliders). Others didn't (alarm lights → ???). The digital version needed new patterns for new capabilities. The art was knowing when to preserve and when to innovate.
I'd user test earlier with actual facilities technicians. I designed based on observation and assumption for too long. Direct feedback from users operating the real system would have caught issues sooner — like the mobile responsiveness problems I only found late in development.
What's Next
The platform continues evolving:
- Predictive maintenance (AI detecting equipment likely to fail)
- Energy optimization recommendations
- Multi-building portfolio views
- Integration with other building systems (lighting, security)
- Mobile app for technicians in the field
Gallery


